[Book] Commented summary of Probabilistic Graphical Models -- A New Way of Thinking in Financial Modelling
[Book] Commented summary of Probabilistic Graphical Models – A New Way of Thinking in Financial Modelling
Very good book, very refreshing read different than your typical machine learning in finance book or average medium blog post.
I studied probabilistic graphical models (PGMs) in an excellent course at ENS with Francis Bach and Guillaume Obozinski, themselves former PhD students of Michael I. Jordan. I was convinced PGMs could have important applications in finance, but not much has been published on this topic so far; Except for Alexander Denev’s book, which is a brilliant exposition on how these models can be useful in finance.
One of the main (soft) teaching of the book, which may disturb machine learners/data scientists/econometricians/statisticians, is that more data is not always relevant. This is particularly true in finance and economy with the environment and associated regulations changing frequently and abruptly. More data, often from further in the past, is barely relevant to model crises which are all different in their own ways, or events which have no historical precedents. Expert judgement is better than irrelevant data in such cases. Moreover, historical data is always backward-looking; Experts can have forward-looking views. The author shows that PGMs are a very practical tool to combine experts’ expectations on many possible scenarios. The book is focused on risk modelling and stress testing, but it is not hard to see how it can be extended for investment and trading purposes.
I think that PGMs should be the ‘pocket calculator’ of discretionary portfolio managers (be it global-macro or corporate fundamentals ones). Many (if not all) think in terms of probabilities of such or such scenario happening. They may think that if such scenario has more than 66% chance of happening, then they will put this trade on. With each new pieces of information arriving, they revise their expectations, and potentially their actions. Many such traders are also skilled poker players. However, the real world is much more complex than the poker rules, and maintaining mentally a consistent view on the probabilities of a large number of scenarios should be close to impossible: Their mental map of marginal and conditional probabilities could actually lead to an impossible joint probability.
The benefits I can see for a PGM ‘pocket calculator’:
-
For the discretionary portfolio manager, PGMs would be the ‘mechanical’ tool to ensure that his probabilistic view of the world remains consistent at all times.
-
PGMs would also allow him to request what would be the new probabilities after observing an event (e.g. getting the latest political polls or the result of an election, reading an economic survey or the release of macroeconomic numbers, watching an explosion happening live on Bloomberg News), that is nowcasting: Integrating information fast and consistently.
-
The portfolio manager could also perform causal and/or forward-looking analysis: “What would happen if there were a third global wave of COVID-19? Which companies would benefit from it? Which companies would be impacted the most? What if the central banks intervene?”
In short, PGMs are a good way to merge subjective ‘bayesian’ probabilities from experts, with more ‘objective’ frequentist probabilities estimated from historical relationships in the data, with market implied probabilities (e.g. the probability of default implied by CDS or credit spreads, with the caveat that these implied default probabilities live in the risk-neutral world whereas we are trying to estimate real-world probabilities).
PGMs seem they could be a major quantamental tool for portfolio managers.
Part 1 Introduction to probabilistic graphical models
Chapter 1 Background and Motivation
The first chapter covers a wide range of topics from the epistemology of risk to the mathematical definitions and properties of Value-at-Risk (VaR), Conditional Value-at-Risk (CVaR) and Credit VaR. It also covers statistical and econometrics limitations such as nonlinearities, structural breaks and outliers. The main point is that PGMs allow for forward-looking scenarios and stress testing whereas standard statistics only allow backward-looking analysis. To study causality, econometrics has only to offer either simplistic tool (Granger causality) or hardly practical ones (SEMs and SVARs), whereas Bayesian networks (having a directed acyclic graph (DAG), a subclass of PGMs) can very intuitively capture causal relationships between variables. They allow to study counterfactuals, hypothetical scenarios (e.g. useful for designing policies as a regulator or a central bank), and, for a given outcome they allow to trace back its associated scenarios (e.g. reverse stress testing).
A list of available software:
They all feel terribly old…
Chapter 2 Probabilistic Graphical Models: An Introduction
In this chapter, you learn the necessary mechanics of probabilistic graphical models. It reads more like a standard graduate textbook, e.g. Probabilistic Graphical Models: Principles and Techniques.
There are different types of PGMs:
- Bayesian networks (directed acyclic graphs)
- Markov random fields (undirected graphs)
- Chain graphs (acyclic graphs containing both directed and undirected edges)
Each of these PGMs have different properties and modelling benefits/drawbacks associated to their structure.
If causality is the main focus (e.g. interventional queries), Bayesian networks. If mainly associational information is available and of interest, Markov random fields. A mix of both associational and causal information? Chain graphs.
Nodes of the graph are random variables. They can have either a discrete or continuous distribution.
Chapter 3 Probabilistic Graphical Models: Filling in the Information
This chapter discusses the possible source of information one can input to such PGMs in the context of financial risk modelling: “[…] knowledge derived from history, so past events (or data sets) are one of the potential ‘repositories’ of future probabilities. Expert domain knowledge either from one person or from aggregate expert surveys can also be used advantageously. Implied information from markets, political polls and physical models in the case of exogeneous variables (floods, oil reserves depletion models) could complement the picture.”
The author classifies these different sources of information in broad categories:
-
“objective” sources of information
-
expert and other input
-
historical data
-
market-implied information
Part 2 Applications
“Once we have a way to build forward-looking distributions through PGMs, we have a myriad potential applications to explore.”
Chapter 4 Stress Testing
Descriptions of Basel I, II, III, and the emerging need and requirement for stress testing. Stress testing can be categorised into sensitivity analysis, scenario analysis, and reverse stress testing.
-
sensitivity analysis: perturbation of one or more risk drivers of a balance sheet in an adverse direction
-
scenario analysis: based on either a historical or forward-looking hypothetical trigger event and its unfolding
-
reverse stress testing: finding a particularly severe scenario that could bring the institution to an insolvency and work back its causes
PGMs are particularly suitable for scenario analysis and reverse stress testing.
Then, for the rest of the chapter, the author exposes a few examples.
Chapter 5 Asset Allocation
In this chapter, the author demonstrates how PGMs can be useful for asset allocation in presence of structural breaks using the following example:
Chapter 6 Credit Risk in Loan Portfolios
The authors shows how to estimate the loss distribution of a credit portfolio using Bayesian networks.
Chapter 7 Financial Networks
“In this chapter we give applications of PGMs to the study of networks and network phenomena, such as default contagion […].”
policy makers are currently not only refining the regulatory and institutional set-up, but also looking for new analytical tools that help to better identify, monitor and address sources of systemic risk.
– European Central Bank 2010
I am quite familiar with this topic, and update frequently a review of two decades of correlations, hierarchies, networks and clustering in financial markets. However, PGMs are barely mentioned in this review (as not much has been published on them and their financial networks applications). Most of the networks between firms investigated are deterministic and estimated from stocks returns correlations or supply chain information; In a few rare cases, using debt or corporate payments (but this information is usually not publicly available, and hard to obtain, even for a regulator). These probabilistic networks should deserve more attention.
Using various flavours of PGMs, one can estimate the distribution of the number of defaults, the distribution of losses, or even the distribution of losses after an intervention (from a central bank) on node (i.e. firm) X. For a policy maker, this can help select the most effective course of action: What is the node (or subset of nodes) on which one should target efforts to maximize the benefits (i.e. optimize some risk/reward utility function)?
Relevant papers to go further:
-
Learning network structure of financial institutions from CDS data
-
Contagious defaults in a credit portfolio: a Bayesian network approach
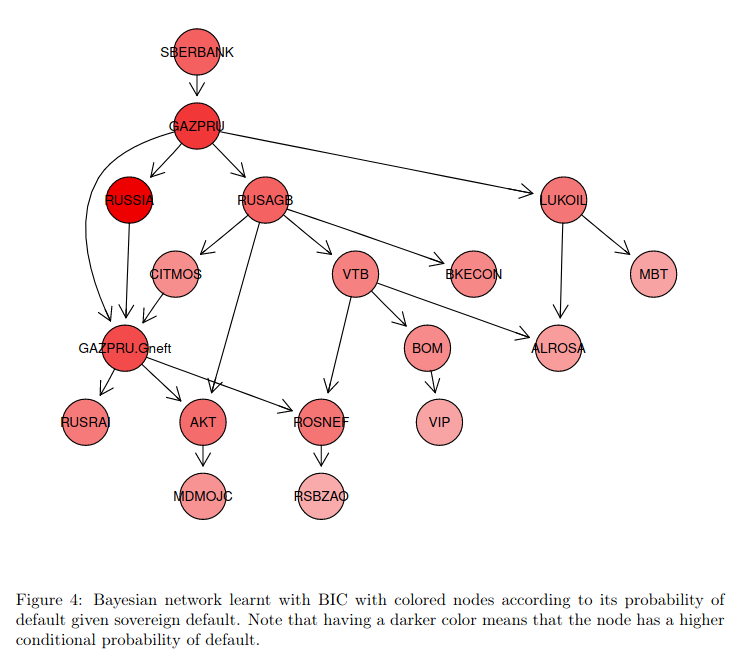 Figure from 'Contagious defaults in a credit portfolio: a Bayesian network approach'
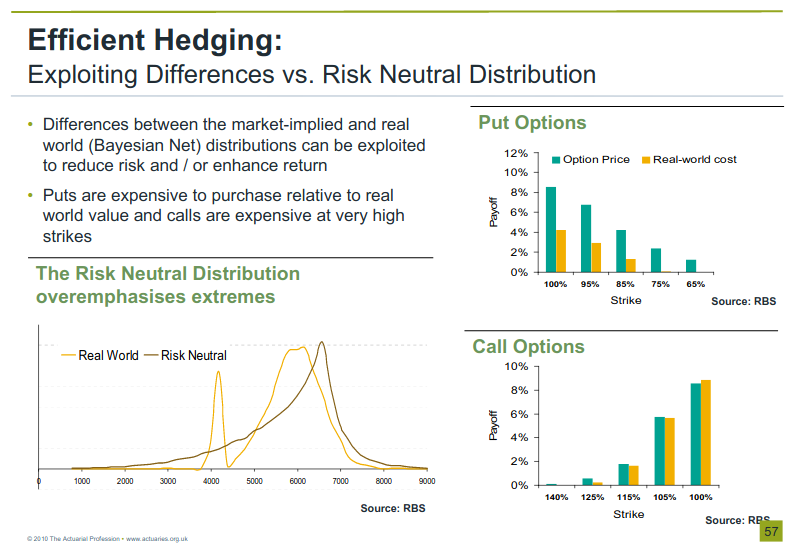
Chapter 8 Hedging
Most often than not, hedges are set in normal times based on historical relationships. However, these relationships may break in stressed times, especially for new types of crises with no historical precedents. PGMs can allow hedging under extreme scenarios since PGMs can give rise to non-zero probability masses in areas where historical data assign a probability of zero.
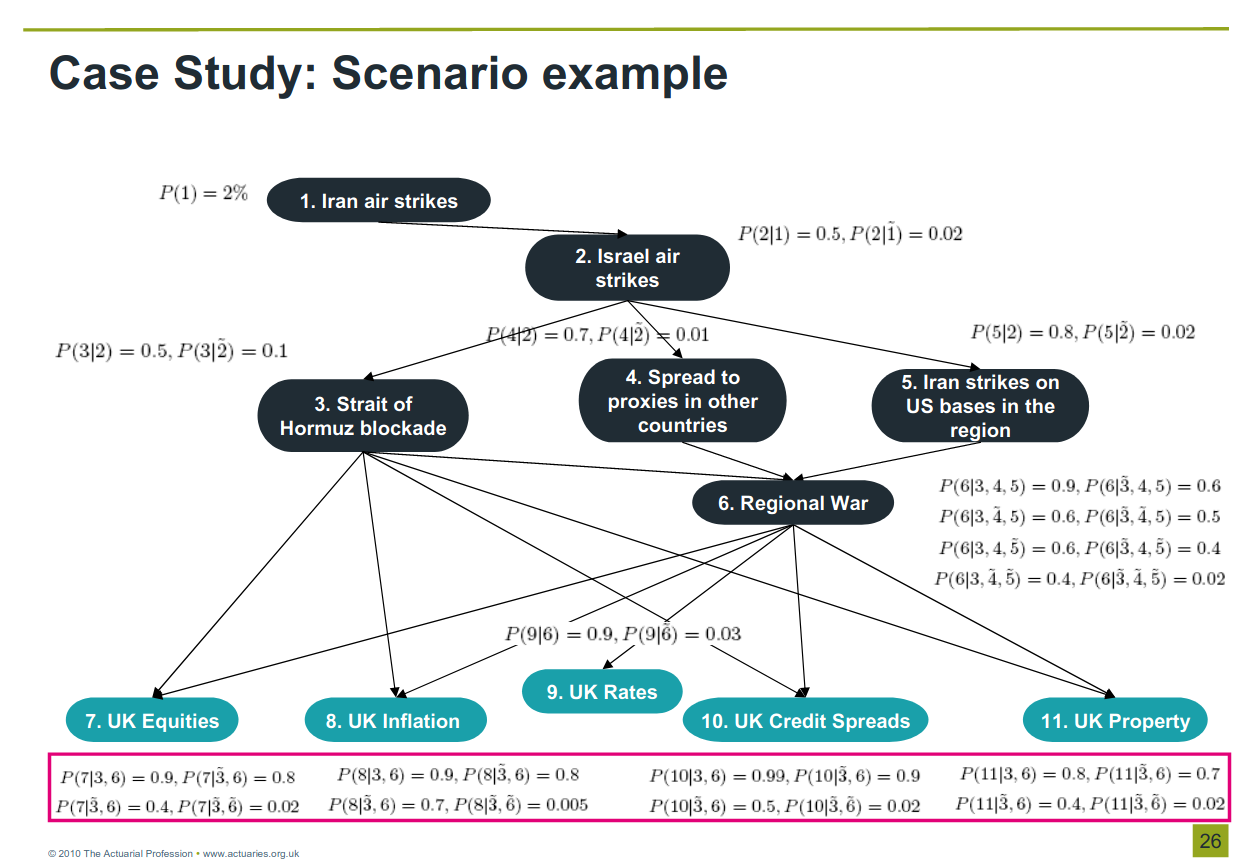
Chapter 9 Case Study: When a Country Is Split
This very relevant chapter shows how one can use PGMs to model a terribly complex and major political event: the independence of Scotland from the UK.
The final bayesian net comprises 20 nodes which represent variables such as oil prices, oil reserve share, oil reserve income, debt share, currency and monetary policy, foreign exchange, central bank rates, gross domestic product, external position, fiscal position, credit rating, bank’s relocation, bank’s spreads, Bank of England rate, nominal rates for Scotland and the rest of UK, credit spreads for Scotland and the rest of UK, inflation for Scotland.
A careful expert analysis stands behind each variable to define the marginal and conditional probabilities.
Chapter 10 Case Study: The Impact of an Interest Rate Hike on Mortgage Default Rates
Another detailed study where the author shows he can estimate the distribution of the PDs (probability of defaults) and LGDs (loss given defaults) of the obligors in the portfolio across many realisations of the macroeconomic variables.
With the model, one can also perform reverse stress tests such as:
-
What is the most probable scenario for the mean PD of the portfolio to be larger than x?
-
What is the most probable macroeconomic scenario that will lead to a portfolio net income (= income - expected loss) in the range [x%, y%]?